
We counted every tour we ran between 26 April and 8 October 2026 — 108 trips across Georgia. Below: where our travellers go, in groups of what size, in which months, and how this compares with Georgia's official statistics. This is not a survey or a market estimate; these are actual trips from our booking system.
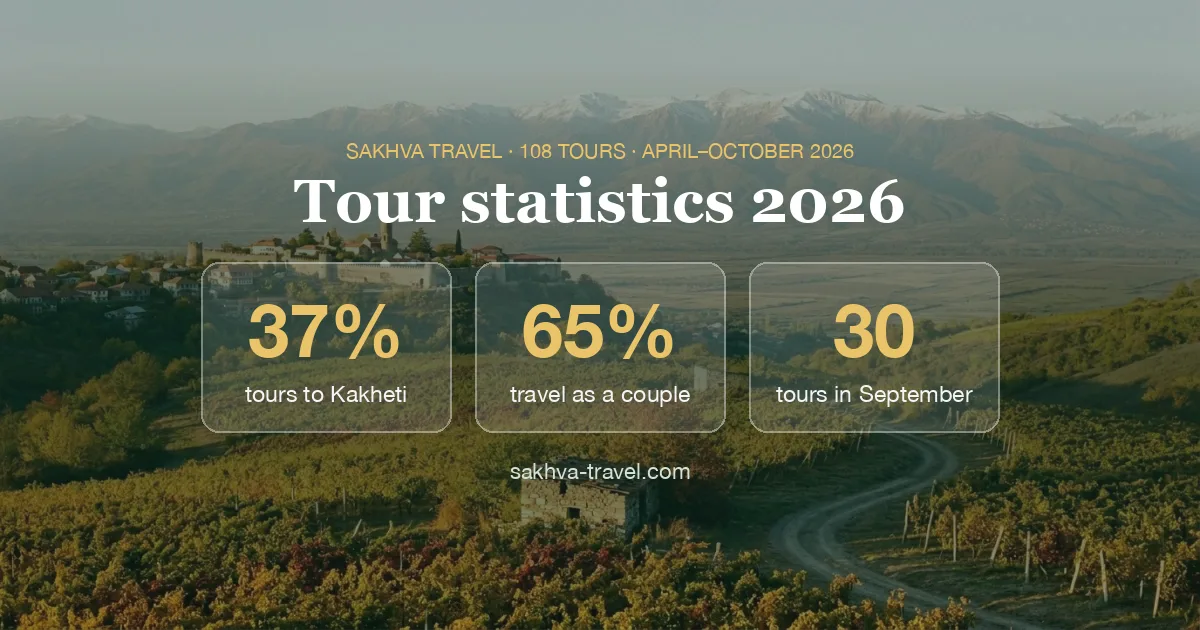
Key numbers
Where travellers go: destinations
| Destination | Share · tours | Time | From |
|---|---|---|---|
| Kakheti | 37% 40 | 10–12 h | ₾170 |
| Tbilisi (walking tours) | 19% 21 | 5 h | ₾135 |
| Kazbegi | 17% 18 | 12 h | ₾175 |
| Mtskheta | 8% 9 | 3–4 h | ₾98 |
| Borjomi | 6% 6 | 10–11 h | ₾178 |
| Batumi | 5% 5 | 1 day | ₾250 |
| Other | 8% 9 | — | — |
“Other” is 8%: Kutaisi and the canyons, Gori and Uplistsikhe, Dashbashi, Tusheti and custom routes. “From” is the lowest per-person price in our October 2026 catalogue; the final price depends on the number of people.
Why Kakheti comes first
Kakheti came first in every month from July to September, not only in the rtveli harvest season: we ran 11 tours there in July, 9 in August and 11 in September. Our explanation is wine and logistics: in one day you visit two wineries, Sighnaghi and Bodbe Monastery, and nobody should drive after a tasting. The tour takes 10–12 hours, from ₾170 per person; see our Kakheti day trip guide for the route.
Tbilisi is second: many travellers start with a walking tour of the Old Town — 5 hours, from ₾135. Kazbegi is third: the longest of the popular day trips, 12 hours on the road and in the mountains, from ₾175.
Who they travel with: group size
| People in the booking | Share of bookings |
|---|---|
| 1 person | 9% |
| 2 people | 65% |
| 3–4 people | 15% |
| 5–7 people | 5% |
| 8 or more | 6% |
Group size is recorded in 87 of 108 bookings. The median is 2 people, and 94% of bookings are for up to 7. That is why all our tours are private by default: only your party in the car. The per-person price depends on how many of you there are — each tour page calculates it.
When they travel: tours by month
| Month | Tours |
|---|---|
| April (from the 26th) | 1 |
| May | 6 |
| June | 8 |
| July | 23 |
| August | 28 |
| September | 30 |
| October (1–8) | 12 |
July to September account for 75% of all trips (81 of 108). October is incomplete — only the first 8 days, which already had 12 tours. If you plan to travel in September, agree on a date early: it is our busiest month.
Our data vs Georgia's official statistics
The National Statistics Office of Georgia (Geostat) records which regions foreign visitors go to. In its 2025 report most visits were to Tbilisi (36.2%) and Adjara (25.7%), while Kakheti had only 4%. In our tours Kakheti is 37%.
The two numbers measure different things: Geostat counts all visits, including business trips and transit, while we count only guided tours. Our explanation of the gap: fewer visitors stay overnight in Kakheti — they go for a day from Tbilisi, and that is exactly the trip people most often take a guide and a car for: the drive, the wineries, the tastings.
| Region | Foreign visits, Geostat 2025 | Our tours 2026 |
|---|---|---|
| Tbilisi | 36.2% | 19% |
| Adjara (Batumi) | 25.7% | 5% |
| Mtskheta-Mtianeti (Mtskheta, Kazbegi) | 11.1% | 25% |
| Samtskhe-Javakheti (Borjomi) | 5.9% | 6% |
| Kakheti | 4.0% | 37% |
What this means for your trip
- September is the busiest month. If you travel in September, book your date early.
- Kakheti and Kazbegi take a full day (10–12 hours). Do not plan them for your arrival or departure day, and avoid two such trips in a row.
- The short option is Mtskheta: 3–4 hours, from ₾98 — good when time is tight.
- Per-person prices depend on group size. Compare formats and costs in how much a private guide costs in Tbilisi.
Methodology
- Source: the Sakhva Travel booking system, all tours with the status “completed”.
- Period: 26 April – 8 October 2026, when we started logging tours in the booking system. Timur has run 500+ tours since 2023, but earlier trips are not included.
- Excluded: transfers, cancelled bookings and single days of multi-day programmes recorded as separate rows.
- Group size is recorded in 87 of 108 bookings; shares are based on those.
- Percentages are rounded to whole numbers and add up to 100%.
- This is one company's data, not Georgia's official tourism statistics. Regional shares for comparison come from Geostat, “Inbound Tourism Statistics (2025)”, 30 January 2026, chart 6.
How to cite this data
You may quote this data with a link to the source: Sakhva Travel, “Tour statistics 2026”, sakhva-travel.com/en/blog/tour-statistics-2026/, 9 October 2026.
The report tables as CSV: tour-statistics-2026.csv (CC BY 4.0 licence — free to use with a link to Sakhva Travel).